19. Reports
Screenshots show the Turkish interface of Prozence with fictional "Örnek Teknoloji A.Ş." data; the English interface has the same layout.
Reports brings the reports of the modules together on one page. Each module has its own tab. In the My reports view, everyone sees only their own data. The Management view is open to the people who have a role in that module in the permission table (Viewer, Operator, Module admin) and to Admin. A manager who has no role in the permission table sees the data of the team that reports to them on the Expense, Leave and Work time tabs.
The tabs you see depend on the modules your company has turned on. A module that is turned off has no tab. The second half of this chapter describes each tab one by one: what it shows, who sees it, which filters work and what is exported.
Who: Employee · Manager · Module owners and viewers · Admin
In this chapter
- Opening the Reports page
- Viewing your own reports
- Viewing the management report
- Downloading a table as CSV
- Tabs and who sees them
- The Expense tab in Reports
- The Leave tab in Reports
- The Work time tab in Reports
- The Requests tab in Reports
- The Asset tab in Reports (including fixed assets)
- The occupational health and safety tab in Reports
- The Customer satisfaction tab in Reports
- The Pulse tab in Reports
- The Business card and signature tab in Reports
- The Payroll tab in Reports
- The Parcel tab in Reports
- The Purchasing tab in Reports
- The Visitor tab in Reports
- The Canteen tab in Reports
- The Occupational physician tab in Reports
- The Communications tab in Reports
- Office report (daily breakdown by office)
Opening the Reports page
Who: Everyone · Where: On a computer, left menu → Reports (on a phone, Profile → Reports)
What it does: Opens the Reports page and lets you select the module and the period you want to look at.
- On a computer, click Reports in the left menu. On a phone, tap Profile in the bottom menu and select Reports in the strip at the top.
- Select a module from the tabs at the top (e.g. Expense, Leave, Work time, Requests, Parcel). The tabs are ordered by the modules that are turned on in your company; when the page first opens, the first tab is selected.
- Select the period in the Period list: This month, Last month, Last 3 months, Last 12 months, This year or Last year. The default is Last 3 months.
- The report opens. At the top, you see the name of the period, the date range and the time of the last update ("Updated: …"). Below them come the summary boxes, a monthly (or daily) bar chart if there is one, the tables and the explanatory notes.
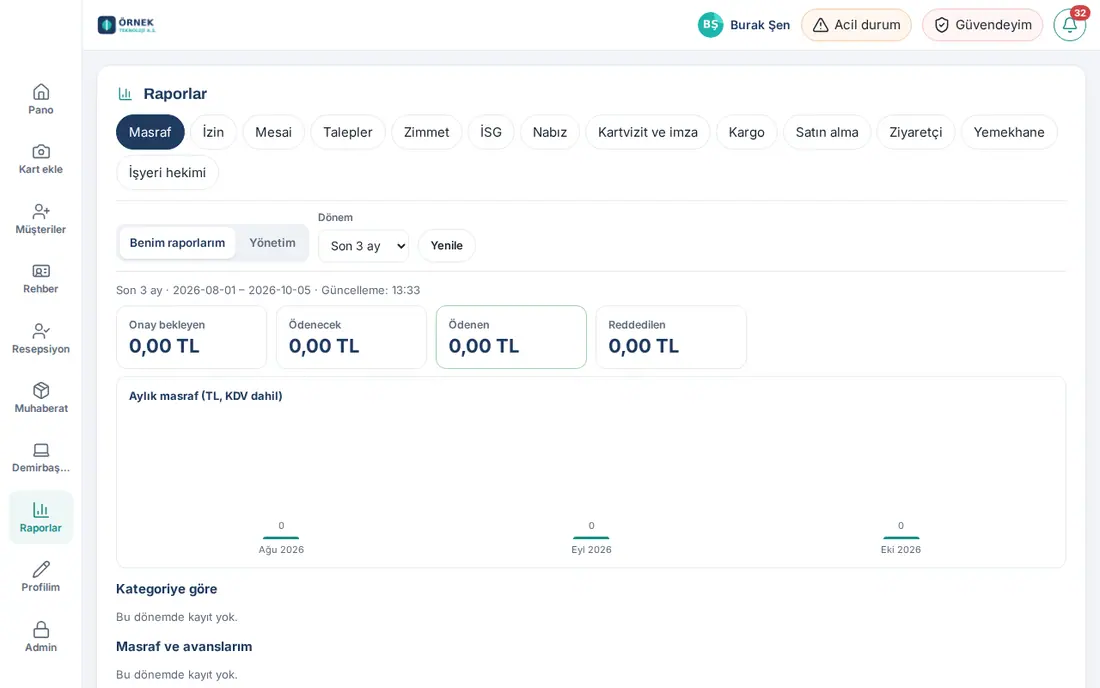
Shortcuts: In the My expenses, Requests, OHS (occupational health and safety, İSG) and Customer satisfaction boxes, the Report button that owners see opens the Management view of the matching tab on this page.
Tip: Reports are kept in the cache for five minutes. To see a new record immediately, click Refresh.
Common messages:
- "No module is turned on in your company." — No module that produces reports is turned on in your company.
- "No records in this period." — The table has no records in the selected period; select another period.
- "No data to show for this period." — The tab has no data at all for the selected period.
- "Too many lookups; try again shortly." — Too many reports were requested within one hour. Wait a while and try again.
Viewing your own reports
Who: Everyone · Where: Reports → tab → My reports
What it does: You see a summary of your own expense, leave, work time, request, asset, parcel, purchasing, visitor, canteen and other records.
- Select a tab. If you have no management permission, your own report opens directly. If you have permission, click My reports.
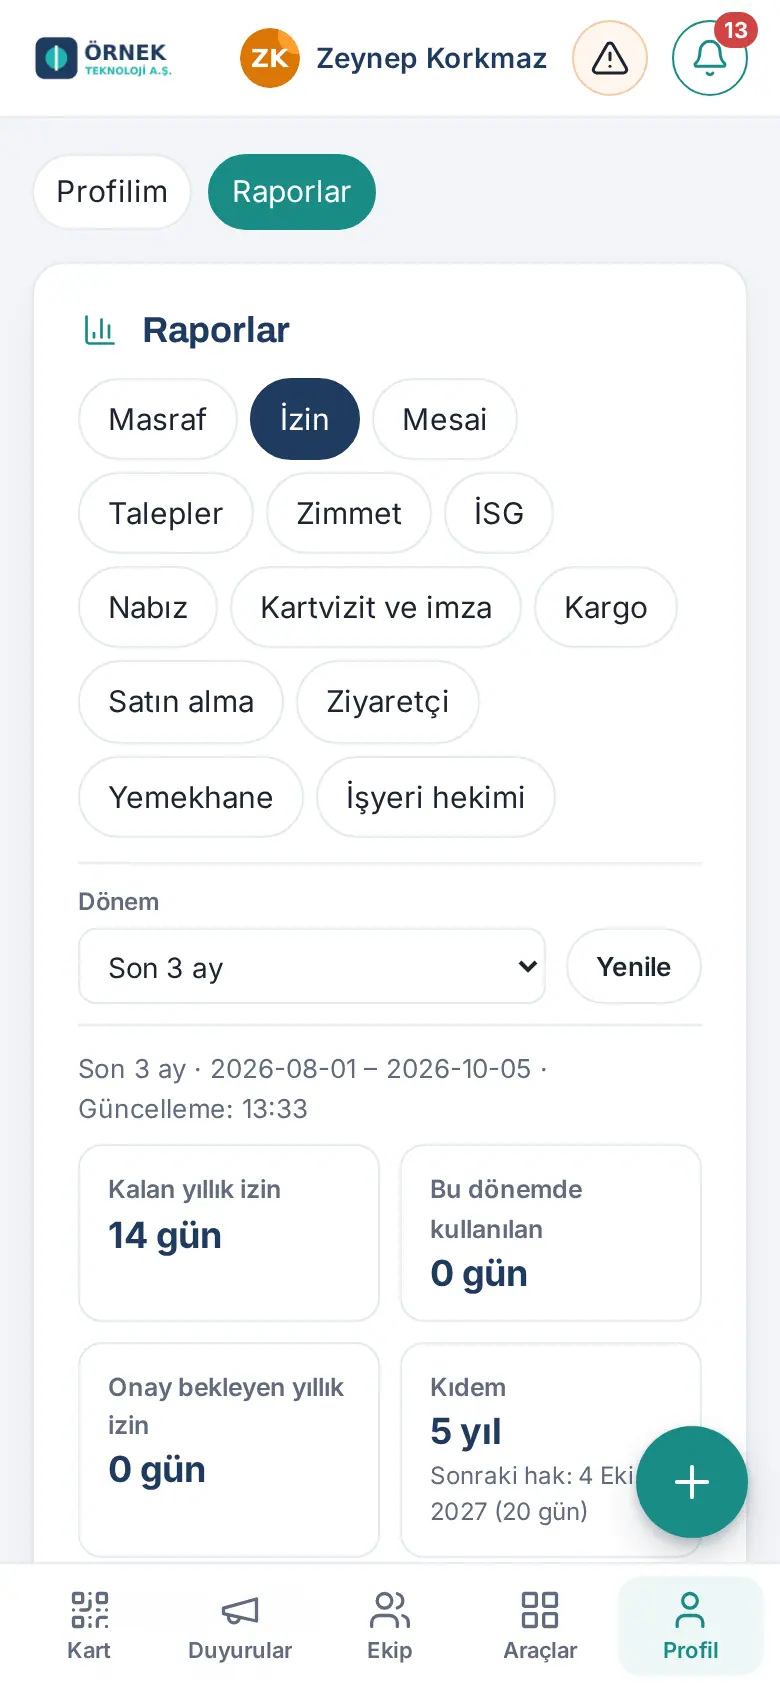
- Read the summary boxes at the top. For example, Expense shows the Awaiting approval, To be paid, Paid and Rejected amounts; Leave shows Annual leave remaining, Used in this period, Annual leave awaiting approval and Seniority. A box with an orange border shows a situation that needs attention.
- The monthly chart and the tables are below (e.g. expenses by category, your leave requests, monthly work time summary, your shipments).
On a phone: The summary boxes appear in two columns; wide tables scroll sideways.
Important: My reports has no Department and Person filters; you select only the Period.
Viewing the management report
Who: People who have a role in that module in the permission table (Viewer and above), Admin; managers (their own team on Expense, Leave and Work time) · Where: Reports → tab → Management
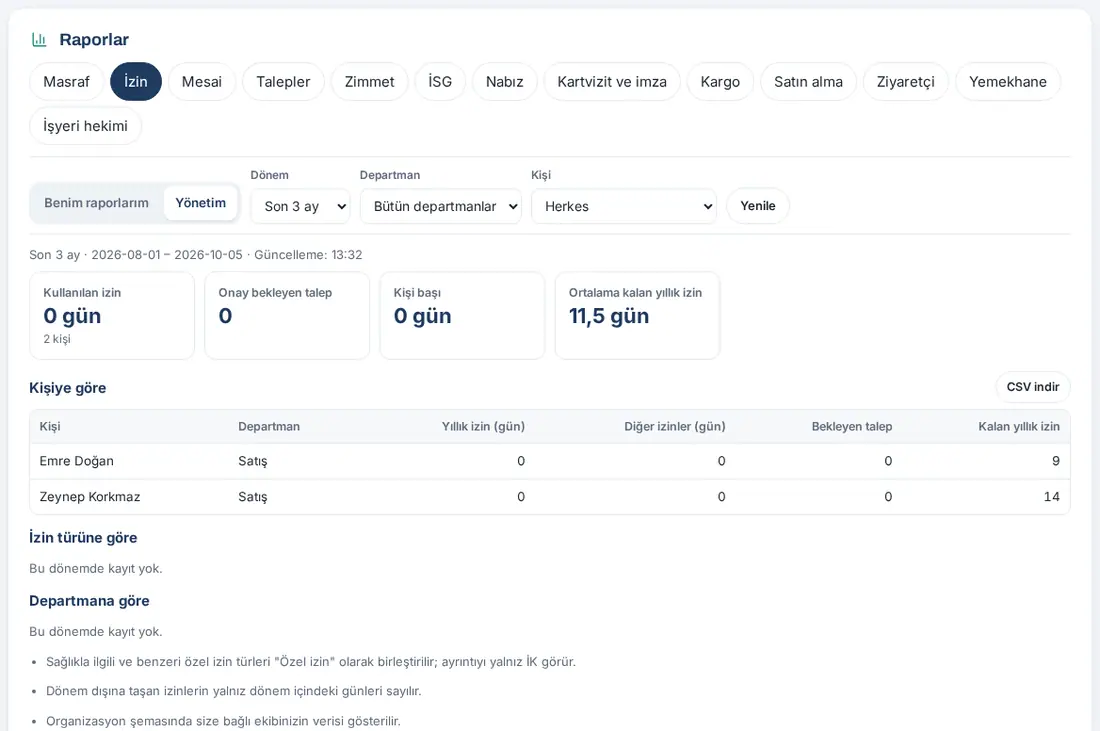
What it does: You see the data of the whole company or of your team, filtered by period, department and person.
Before you start: The Management button appears only on the tabs where you have permission. For who sees which tab, see Tabs and who sees them.
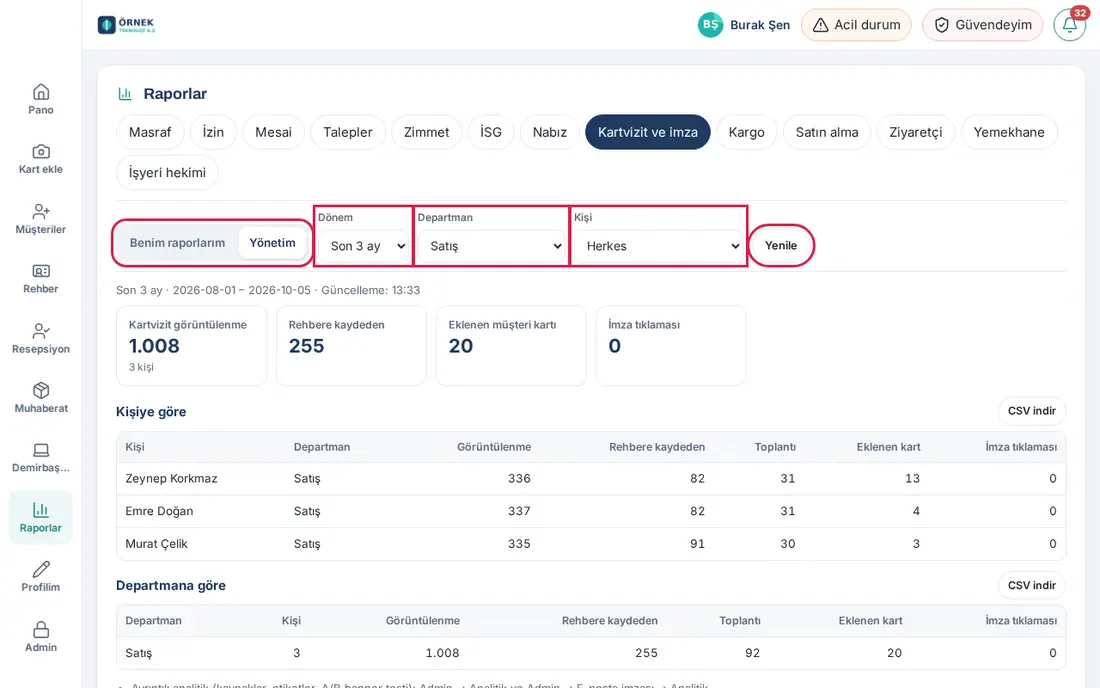
- Select a tab and click Management.
- Select the Period.
- If you want, select a department in the Department list (the default is All departments). The Person list narrows to the employees of that department.
- If you want, select an employee in the Person list (the default is Everyone).
- The summary boxes, the chart and the breakdown tables refresh for your selection.
- If the module has its own detailed report (the Expense report with Excel; the Requests, OHS and Customer satisfaction windows), click Detailed report.
Team scope (manager): If you have no role in the Expense, Leave or Work time module in the permission table but employees report to you in the organization chart, the Management view on these three tabs shows only your team. The note "Data for the team reporting to you in the organization chart is shown." appears below the report; the Person list contains only your team.
Common messages:
- "You are not allowed to see this module’s management report." — You have no role in this module in the permission table. You can see your role in My profile → My permissions (see 00. Getting started).
- "You are not allowed to see this person’s report." — The person you selected is outside your scope (e.g. not in your team).
- "This report is turned off in this company." — The module was turned off; refresh the page.
Important:
- The OHS, Pulse and Occupational physician tabs have no Department and Person filters (reports can be anonymous, answers are anonymous, and health data is not filtered by person).
- Special leave types such as sick leave are combined as "Private leave" for viewers outside HR; only HR sees the details.
- The Payroll report does not contain the contents of payslips; it shows only the upload and receipt confirmation status.
Downloading a table as CSV
Who: Everyone · Where: Reports → any table → Download CSV
What it does: Downloads the table you see on the screen as a file that you can open in Excel.
- Click Download CSV at the top right of the table.
- The file downloads with the name
rapor-<module>-<table>-<period>.csv(e.g.rapor-satinalma-kategori-son_3.csv). - Open the file in Excel. Turkish characters show correctly; columns are separated by semicolons and decimals use a comma. Hour columns have "(sa)" ("h") in their heading.
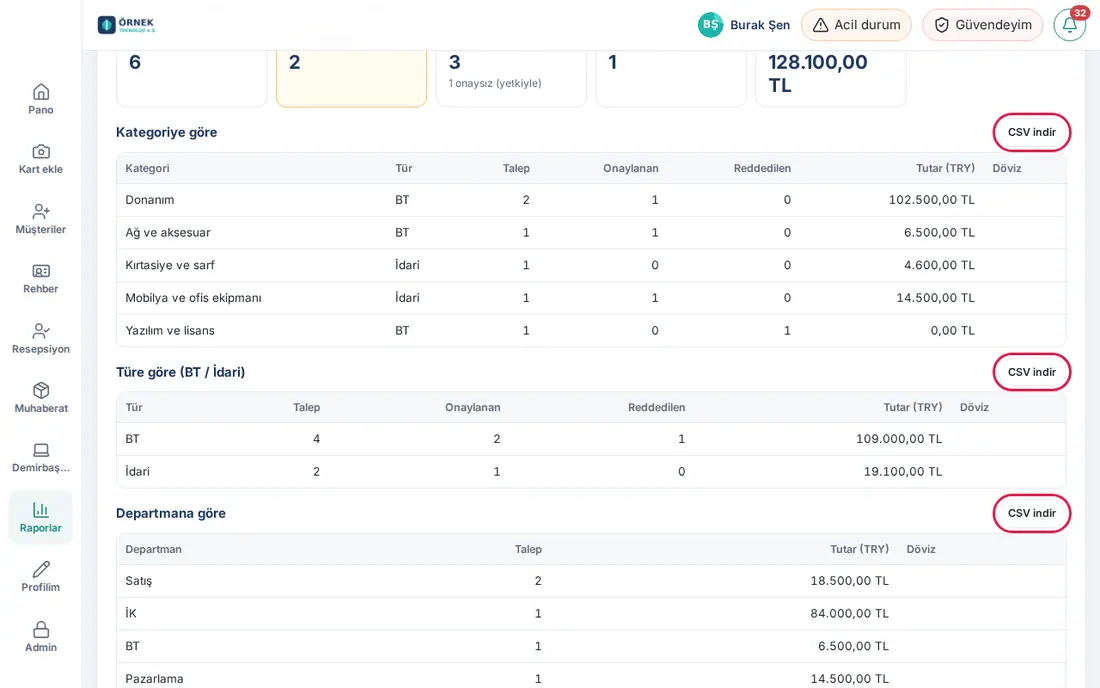
Tip: If a table has more than 50 rows, the first 50 rows show on the screen; to see all of them, click Show all (N). The CSV always contains all rows. An empty table has no Download CSV button.
Important: The CSV contains the selected period and (in Management) the selected department / person filter. The file you download can contain your colleagues' data; do not send it outside the company.
Tabs and who sees them
Who: Everyone · Where: Reports → tabs
What it does: Shows in one table when each tab appears and who can open the Management view.
A tab appears only if the related module is turned on in your company. My reports is open to everyone on every tab that is turned on. The table below shows the Management view. "Has a role in the permission table" means the people who are Viewer, Operator or Module admin for that module in Admin → Permissions (see 10. Administration and setup).
| Tab | Who opens the Management view | Department / Person filter | Detailed report |
|---|---|---|---|
| Expense | People with an Expense role in the permission table (including accounting), Admin; a manager without a role sees only their team | Yes | Yes (Excel) |
| Leave | Leave owners (HR), people with a Leave role in the permission table, Admin; a manager without a role sees only their team | Yes | No |
| Work time | Work time owners, people with a Work time role in the permission table, Admin; a manager without a role sees only their team | Yes | No |
| Requests | Request managers and people with a Requests role in the permission table (all categories); category owners (only their own categories) | Yes (applied to the requester) | Yes (Overview) |
| Asset | Asset owners, people with an Asset role in the permission table, Admin | Yes | No |
| OHS | OHS owners, people with an OHS role in the permission table, Admin | No | Yes |
| Customer satisfaction | Satisfaction owners, people with a role in the permission table, Admin | Yes | Yes |
| Pulse | Pulse owners, people with a Pulse role in the permission table, Admin | No | No |
| Business card and signature | Admin and Auditor (company role) | Yes | No |
| Payroll | Payroll owners (HR), people with a Payroll role in the permission table, Admin | Yes | No |
| Parcel | Parcel owners, people with a Parcel role in the permission table, Admin | Yes | No |
| Purchasing | Purchasing owners and approvers, people with a Purchasing role in the permission table, Admin | Yes | No |
| Visitor | Visitor owners (reception), people with a Visitor role in the permission table, Admin | Yes | No |
| Canteen | Services manager, people with a Meals and canteen role in the permission table (Viewer and above), Admin | Yes | No |
| Occupational physician | OHS owners and Admin (not the occupational physician themselves) | No | No |
| Communications | Admin and Auditor, people allowed to announce to the whole company, Wiki general editors and people with a Wiki role in the permission table | Yes (not applied to searched words) | No |
Tip: You can see your own roles in My profile → My permissions.
Important: If your permission is taken back, the Management button disappears the next time you open the page; the old report in the cache is not shown either.
The Expense tab in Reports
Who: Everyone (their own expenses) · Accounting, people with an Expense role, managers (their team), Admin · Where: Reports → Expense
What it does: Shows the amounts of expenses and advances, and their breakdown by category and person.
In My reports:
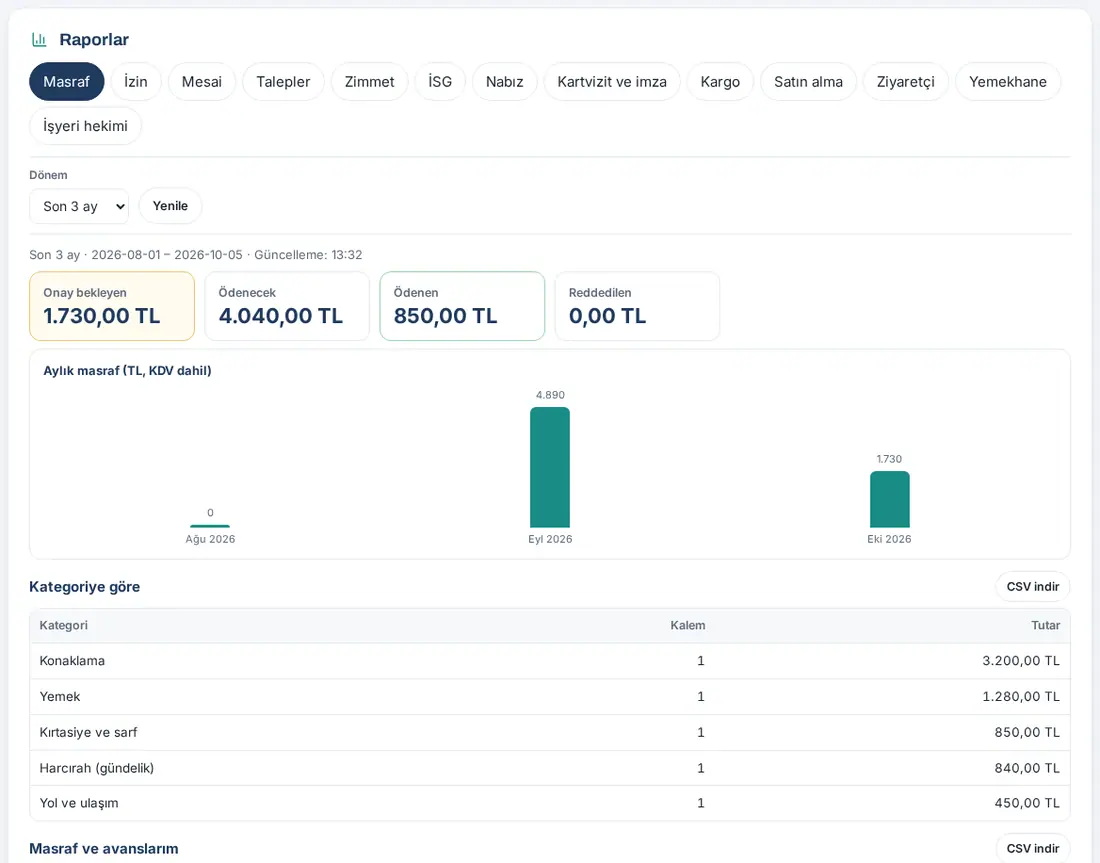
- Boxes: Awaiting approval, To be paid, Paid, Rejected.
- The Monthly expenses (TL, incl. VAT) chart.
- Tables: By category (Category, Items, Amount), My expenses and advances (Submitted, Type, Title, Status, Amount).
- Note: "Drafts are not counted. Amounts are in TL."
In Management:
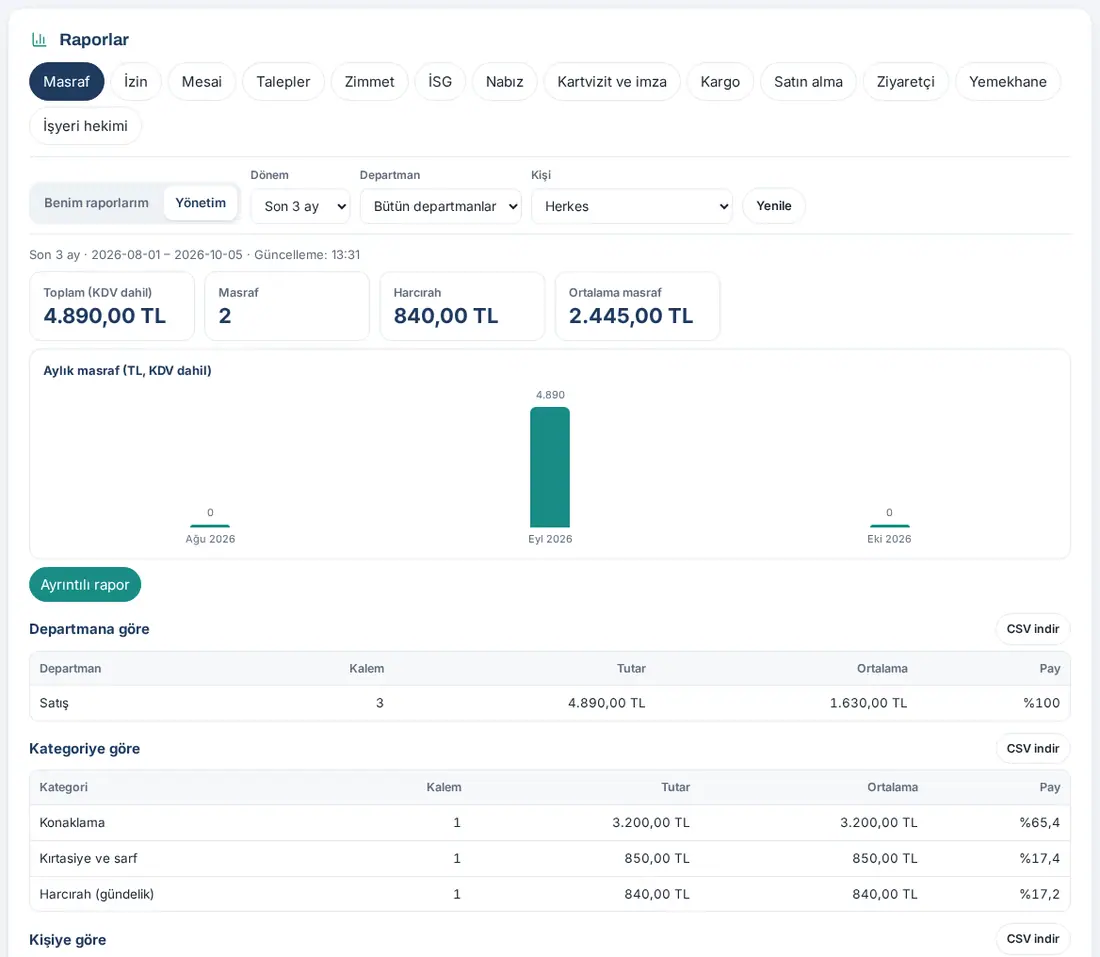
- Boxes: Total (incl. VAT), Expense (count), Per diem, Average expense.
- The Monthly expenses (TL, incl. VAT) chart.
- Tables: By department, By category, By person (Items, Amount, Average, Share).
- Note: only approved expenses (ready for payment, paid, closed) are counted; advances are not expenses and are not counted.
- Detailed report: opens the expense module's own report, which you can export to Excel (see 18. Expense management and accounting).
Filters: Period; in Management, Department and Person. Export: Download CSV on every table; for Excel, Detailed report.
The Leave tab in Reports
Who: Everyone (their own leave) · HR, people with a Leave role, managers (their team), Admin · Where: Reports → Leave
What it does: Shows leave use, pending requests and remaining annual leave.
In My reports:
- Boxes: Annual leave remaining, Used in this period, Annual leave awaiting approval, Seniority (with the next entitlement date below it).
- Tables: By type (approved), My requests (Start, End, Days (in period), Type, Status).
In Management:
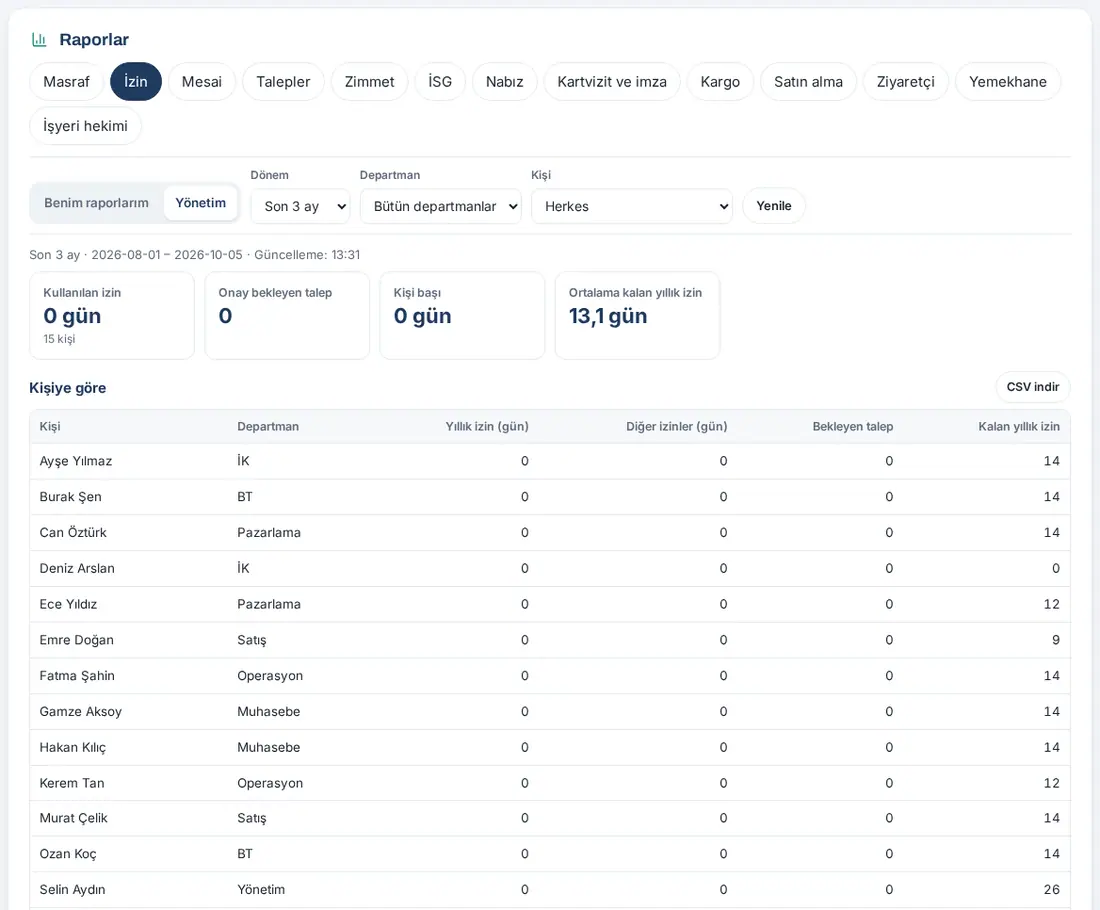
- Boxes: Leave taken (with the number of people), Requests awaiting approval, Per person, Average remaining annual leave.
- Tables: By person (Annual leave (days), Other leave (days), Pending requests, Annual leave remaining), By leave type, By department.
- Note: for leave that runs outside the period, only the days inside the period are counted.
Filters: Period; in Management, Department and Person. Export: Download CSV on every table.
Important: Health-related and similar special leave types are combined as "Private leave" for viewers outside HR. For leave rules and balances, see 21. Employee leave and 30. Employee leave management.
The Work time tab in Reports
Who: Everyone (their own work time) · Work time owners, people with a Work time role, managers (their team), Admin · Where: Reports → Work time
What it does: Shows the numbers of days worked, net working time and overtime, late arrivals, missing check-outs and absences.
In My reports:
- Boxes: Days worked, Net working time, Overtime, Late arrivals / missing check-outs.
- The Monthly net working time (hours) chart.
- Table: Monthly summary (Month, Day, Net, Overtime, Late arrivals, Missing check-out, Absent).
In Management:
- Boxes: Net working time (with the number of people), Overtime, Late arrivals, Missing check-outs / absent.
- Tables: By person (Day, Net, Overtime, Late arrivals, Missing check-out, Absent, Holiday work), By department (Person, Net, Overtime, Absent).
Filters: Period; in Management, Department and Person. Export: Download CSV on every table (hours as decimal hours).
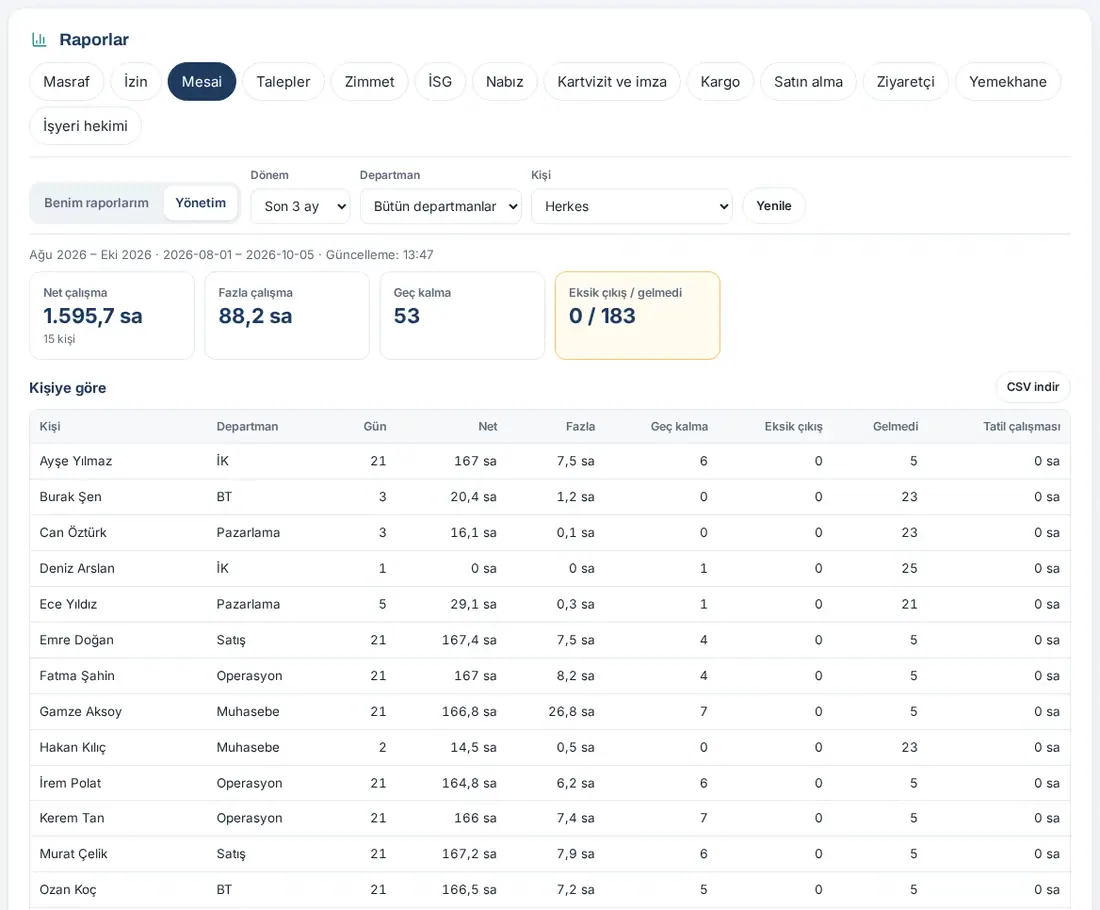
Important: The Work time management report covers at most the last 3 months; if you select a longer period, the note "The time report covers at most 3 months; the last 3 months are shown…" appears. For longer periods and for export to the payroll program, use My Space → Work time → Timesheet (see 29. Time and attendance management). For the daily breakdown by office, see Office report.
The Requests tab in Reports
Who: Everyone (their own requests) · Request managers, people with a Requests role, category owners, Admin · Where: Reports → Requests
What it does: Shows the number of requests, the resolution times, the rate of requests resolved on target and satisfaction.
In My reports:
- Boxes: Requests I opened, Open, Resolved, Average resolution time.
- Tables: By category, My requests (No., Title, Category, Status, Opened).
In Management:
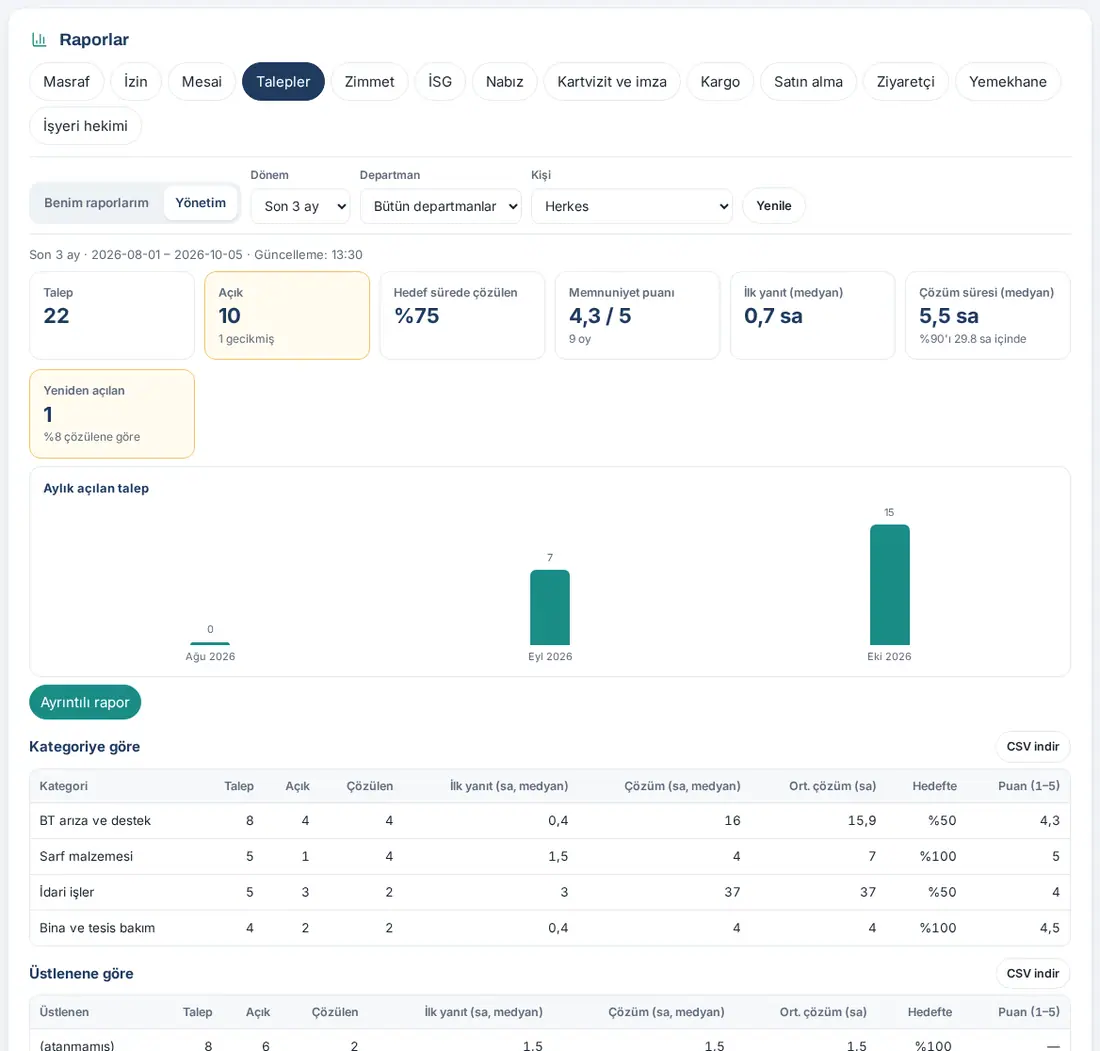
- Boxes: Request, Open (with the number of overdue requests), Resolved on target, Satisfaction score (with the number of votes), First response (median), Resolution time (median) (with "90% within … h" below it), Reopened.
- The Requests opened per month chart.
- Tables: By category, By assignee, By requester’s department (Request, Open, Resolved, First response (h, median), Resolution (h, median), Avg. resolution (h), On target, Score (1–5)) and Resolution time distribution.
- Notes: "First response" is the time from opening until the first reply or status change by the person handling the request; the target clock stops while the request is "Waiting for info"; times are calendar hours (including time outside working hours).
- Detailed report: opens the Overview board of Requests (see 23. Requests).
Filters: Period; in Management, Department and Person (applied to the requester). Category owners see only their own categories. Export: Download CSV on every table.
The Asset tab in Reports (including fixed assets)
Who: Everyone (items assigned to them) · Asset owners, people with an Asset role, Admin · Where: Reports → Asset
What it does: Shows the current status of fixed assets and assigned items, and the incidents such as faults or losses reported in the period.
In My reports:
- Boxes: Items assigned to me, Awaiting receipt confirmation.
- Tables: Items assigned to me (No., Item, Type, Status, Handed over), My incident reports (Incident, Item, Type, Date, Status, Result).
- Note: "Current status (regardless of period)."
In Management:
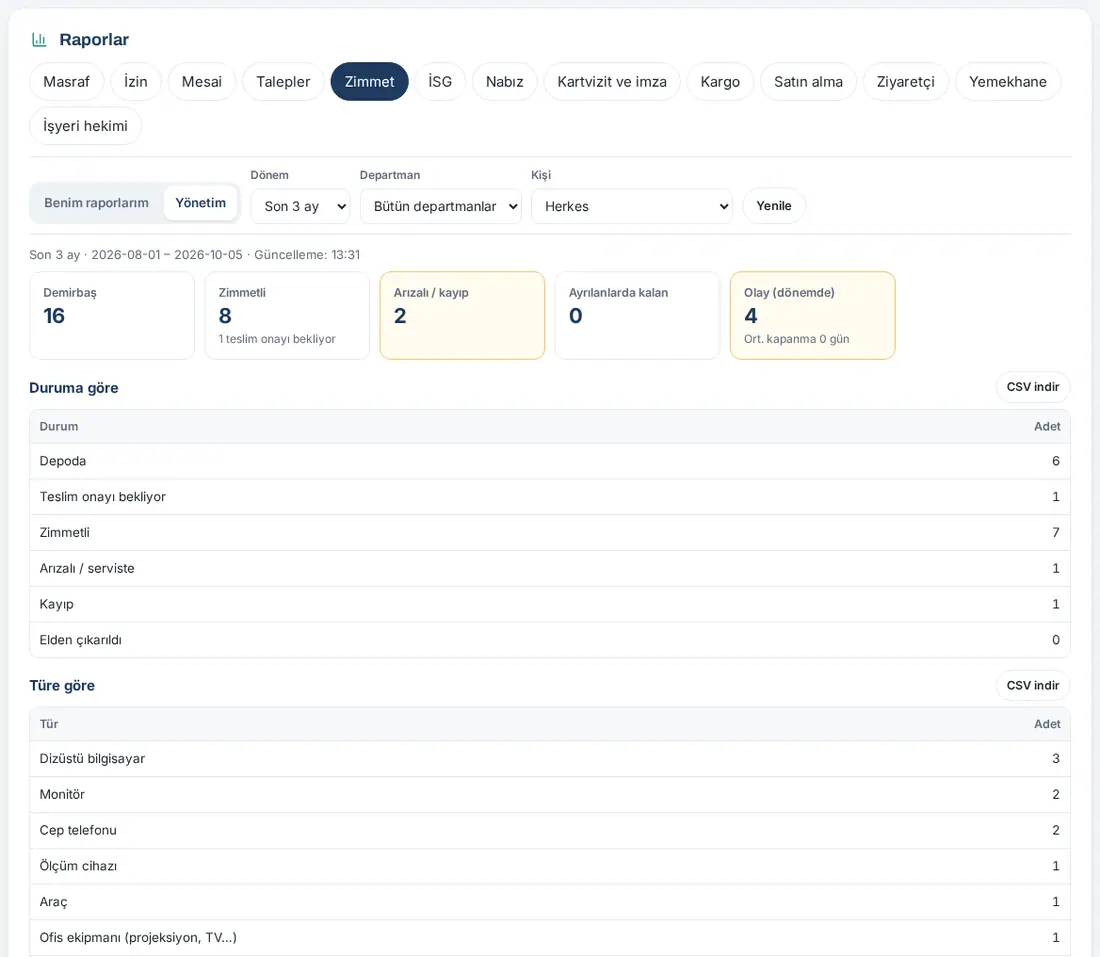
- Boxes: Assets, Assigned (with the items awaiting receipt confirmation), Faulty / lost, Held by leavers, Incidents (in period) (with the average closing time).
- Tables: By status, By type, By holder’s department, Incidents by type, Closed incidents: fault assessment, Incidents (Incident, Asset, Type, Person, Status, Result, Fault, Cost).
- Notes: the cost of closed incidents (by currency; nothing is deducted from salaries, the amount is for the record only), the result of the last count, the total recorded value and the number of movements in the period.
Filters: Period (affects only the numbers of incidents and movements; status numbers are current); in Management, Department and Person. Export: Download CSV on every table.
Tip: For the fixed asset inventory, counts and incident handling, see 28. Fixed assets and asset assignment.
The occupational health and safety tab in Reports
Who: Everyone (their own reports) · OHS owners, people with an OHS role, Admin · Where: Reports → OHS
What it does: Shows the type, status and risk level of occupational health and safety (OHS) reports, and the locations reported most often.
In My reports:
- Boxes: My reports, Open, Closed.
- Table: My reports (No., Type, Place, Status, Date, Anonymous).
- Note: your anonymous reports are also listed, only for you; nobody else sees who reported them.
In Management:
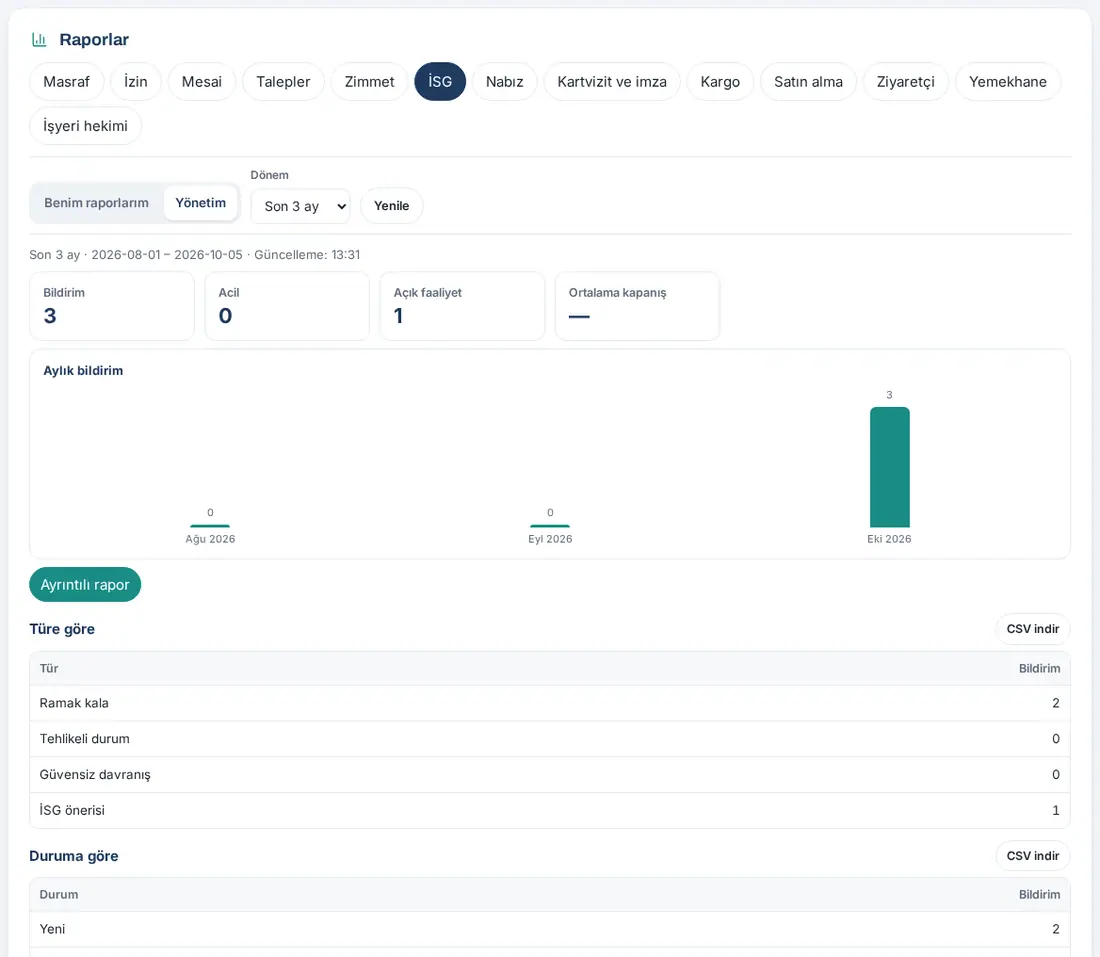
- Boxes: Reports, Urgent, Open actions, Average closing time.
- The Reports per month chart.
- Tables: By type, By status, By risk level, Most reported locations.
- Detailed report: opens the OHS module's own report window.
Filters: Period only (there are no department and person filters because reports can be anonymous). Export: Download CSV on every table.
Tip: For sending reports and for actions, see 27. Emergencies, occupational safety and the occupational physician.
The Customer satisfaction tab in Reports
Who: Everyone (the survey in their own signature) · Satisfaction owners, people with a role, Admin · Where: Reports → Customer satisfaction
What it does: Shows the results of the satisfaction survey in the email signature.
Before you start: The tab appears only if your company has turned on the Customer satisfaction module.
In My reports:
- Boxes: Ratings, Satisfaction (CSAT), Good / fair / poor.
- Table: Comments (Date, Rating, Comment).
- If your signature has no survey, the note "Your email signature does not currently include the satisfaction survey." appears.
In Management:
- The same boxes; the Monthly satisfaction (CSAT %) chart; the By department and By employee tables; Comments (Date, Employee, Rating, Comment).
- Detailed report: opens the module's own report window.
Filters: Period; in Management, Department and Person. Export: Download CSV on every table.
Image: This module is turned off on the demo site, so there is no screenshot of the tab. The general layout of the tab is the same as the other tabs (see Viewing your own reports). For the survey itself, see 02. Email signature.
The Pulse tab in Reports
Who: Everyone (company-wide summary, if the company shares it) · Pulse owners, people with a Pulse role, Admin · Where: Reports → Pulse
What it does: Shows the participation in Pulse surveys and the eNPS trend (the score of how much employees recommend the company).
In My reports:
- Boxes: Last round (with the participation rate), eNPS.
- Table: Company-wide by question (Question, Measure, Result, Response).
- Note: Pulse answers are anonymous; there is no personal report. Here you see the company-wide summary of the last round (if your company shares it).
In Management:
- Boxes: Round, Average participation, Latest eNPS.
- The eNPS (closed rounds above threshold) chart.
- Tables: Rounds (Start, Status, Response, Participation, eNPS), Last closed round: by department (departments below the threshold are in the "Other (combined)" row).
Filters: Period only. Export: Download CSV on every table.
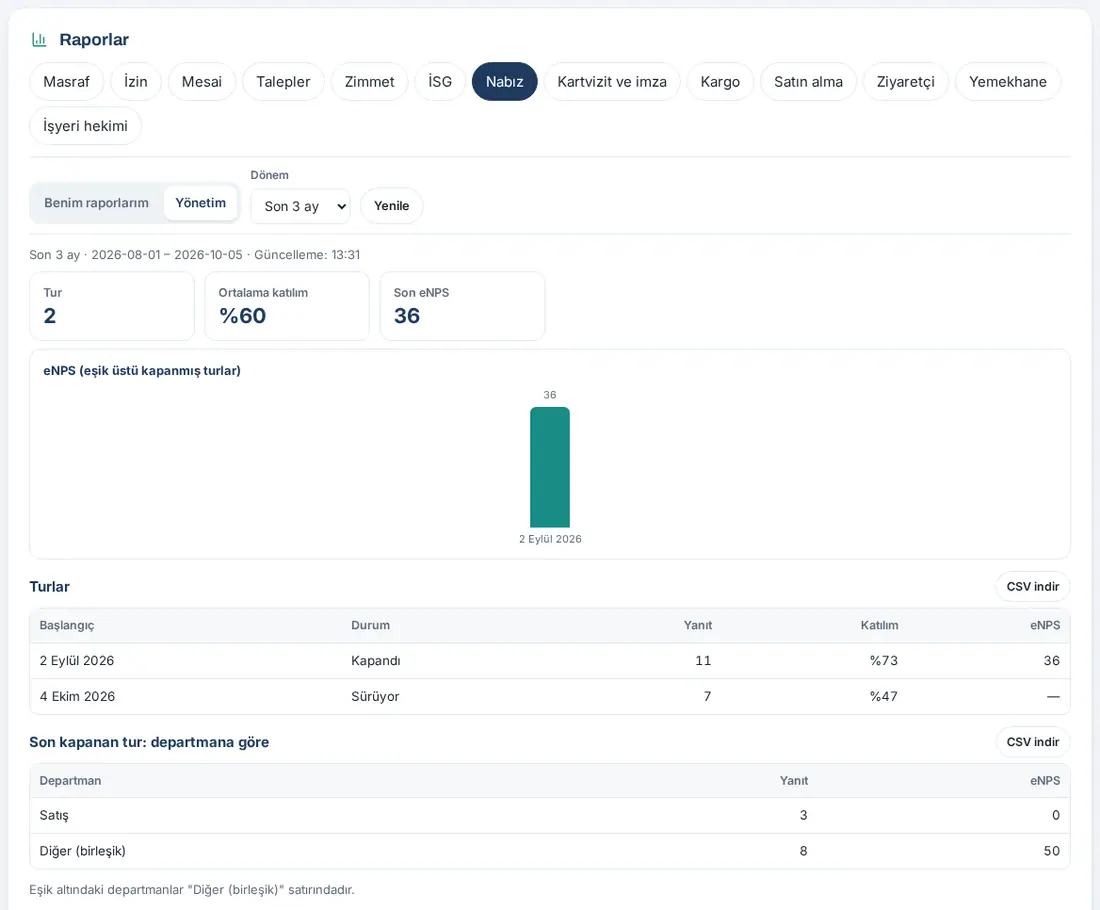
Important: During a round, only participation is shown; the results of rounds with fewer responses than the threshold are not shown. To answer Pulse, see Answering a Pulse survey.
The Business card and signature tab in Reports
Who: Everyone · Admin and Auditor (Management) · Where: Reports → Business card and signature
What it does: Shows how many times the digital business card was viewed and saved to contacts, the use of the meeting link and the signature links, and the customer cards added. This tab is turned on in every company.
In My reports:
- Boxes: Business card views, Saved to contacts, Meeting link, Customer cards I added, Signature clicks.
- The Monthly business card views chart.
In Management:
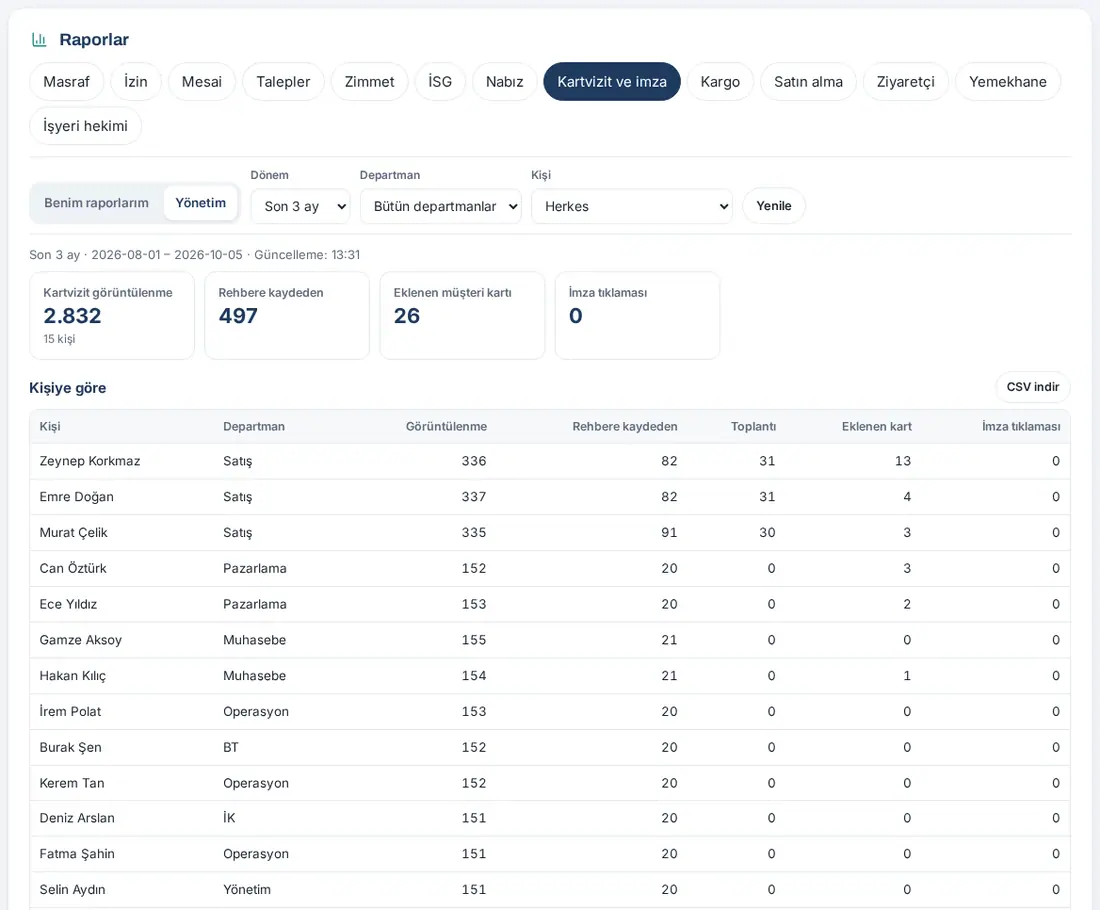
- Boxes: Business card views (with the number of people), Saved to contacts, Customer cards added, Signature clicks.
- Tables: By person, By department (Views, Saved to contacts, Meeting, Cards added, Signature clicks).
- Note: detailed analytics such as sources, tags and the banner A/B test are in Admin → Analytics and Admin → Email signature → Analytics.
Filters: Period; in Management, Department and Person. Export: Download CSV on every table.
The Payroll tab in Reports
Who: Everyone (their own payslips) · Payroll owners (HR), people with a Payroll role, Admin · Where: Reports → Payroll
What it does: Shows the upload and receipt confirmation status of payslips (the record that the payslip was opened and received). The content of the payslip is not in the report.
Before you start: The tab appears only if your company has turned on the payroll module.
In My reports:
- Boxes: Payroll, Awaiting receipt.
- Table: My payslips (Period, Status, Time of receipt, Method).
- Note: to open a payslip, use My Space → My payslips (see Opening your payslip and confirming receipt).
In Management:
- Boxes: Payslips uploaded, Receipt rate, Awaiting receipt.
- Tables: By period (Uploaded, Received, Rate), By receipt method (Email code, SMS code, Direct confirmation), Awaiting receipt (Person, Department, Period, Upload).
- Note: the detailed audit log (IP, browser, PDF digest) is in My payslips → Periods → CSV.
Filters: Period; in Management, Department and Person. Export: Download CSV on every table.
Image: The payroll module is turned off on the demo site at this stage, so there is no screenshot of the tab; for the employee's payslip screens, see Opening your payslip and confirming receipt.
The Parcel tab in Reports
Who: Everyone (their own shipments) · Parcel owners, people with a Parcel role, Admin · Where: Reports → Parcel
What it does: Counts and lists parcel and courier shipments and the deliveries that arrive at the mailroom.
In My reports:
- Boxes: Shipments, Parcel, Courier, Received by me.
- Tables: By content category, My shipments (No., Date, Recipient, Type, Category, Company, Tracking no., Status).
In Management:
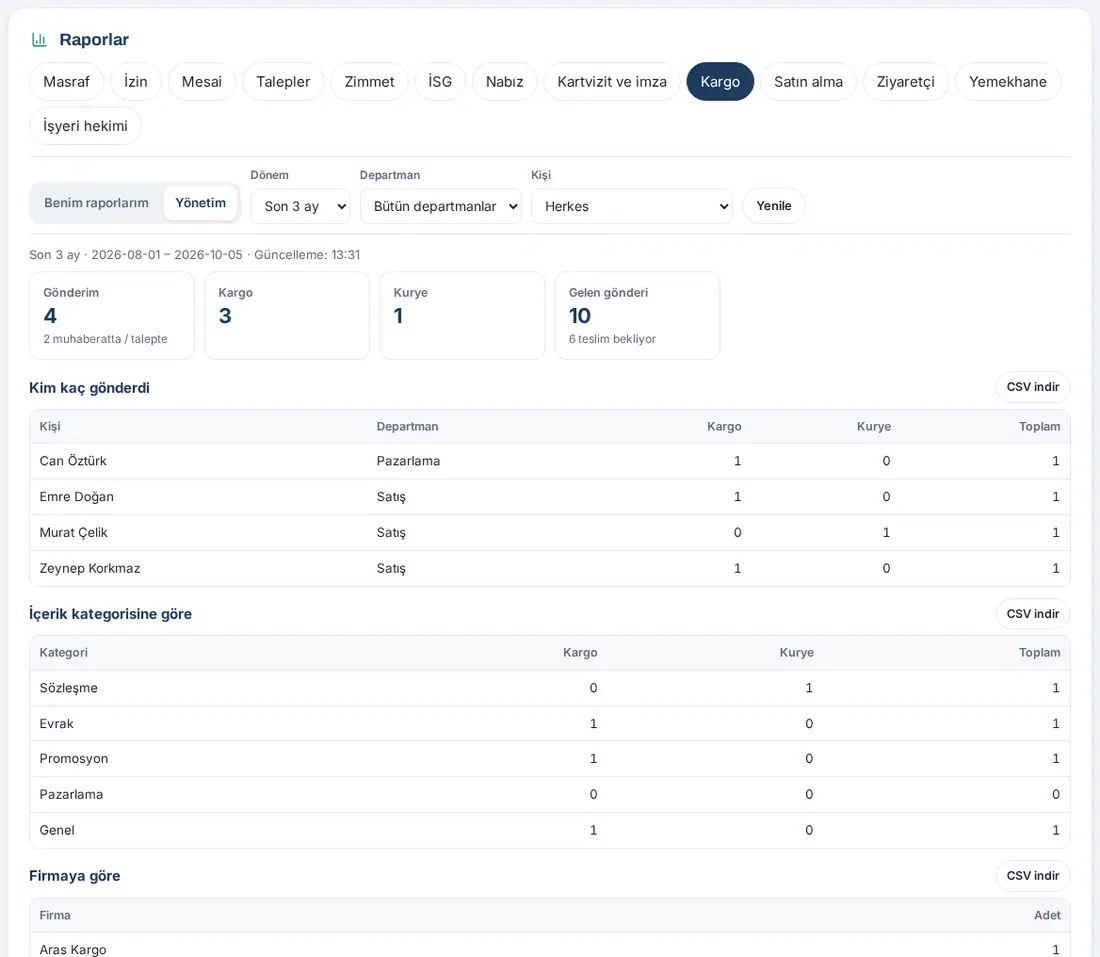
- Boxes: Shipments (with the shipments waiting at the mailroom / in request), Parcel, Courier, Incoming items (with the items awaiting pickup).
- Tables: Who sent how many, By content category, By company, By status, Shipments by department, Incoming items — by person, and the Outgoing shipments and Incoming deliveries lists.
- Note: the period is based on the day the shipment request was opened (for incoming items, the day the record was created); cancelled requests are not counted.
Filters: Period; in Management, Department and Person. Export: Download CSV on every table. The lists have at most 500 rows; for all of them, use Mailroom → Log → CSV.
Tip: For sending parcels and the mailroom desk, see 24. Parcels, mailroom and purchasing.
The Purchasing tab in Reports
Who: Everyone (their own requests) · Purchasing owners and approvers, people with a Purchasing role, Admin · Where: Reports → Purchasing
What it does: Shows the number, approval status and amounts of purchase requests by category, type and department.
In My reports:
- Boxes: Request, Awaiting approval, Approved, Rejected, Amount (TRY).
- Table: My requests (Code, Date, Title, Type, Category, Amount, Status).
In Management:
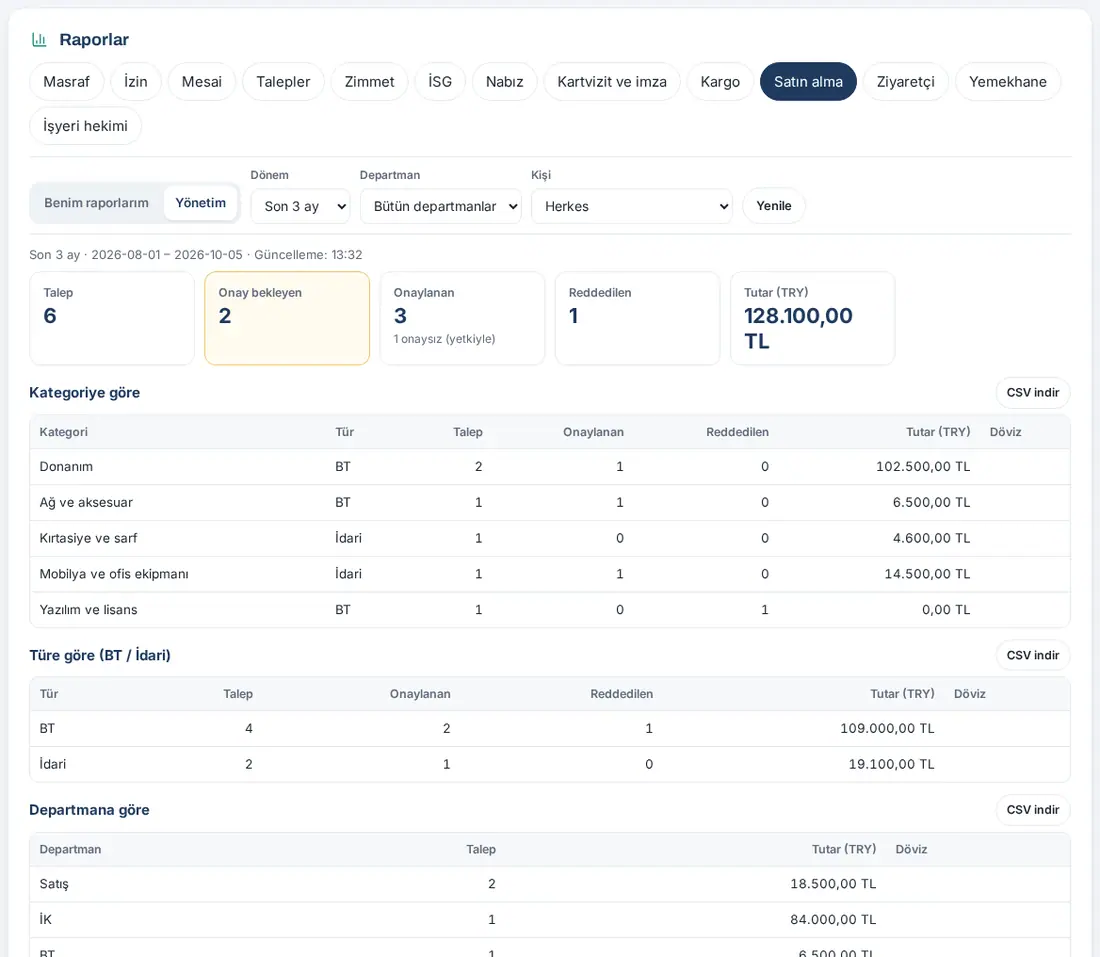
- The same boxes (below Approved, the number of purchases "without approval (authorized)").
- Tables: By category, By type (IT / Administrative), By department, By person, By status, Purchased without approval (authorised).
- Note: the period is based on the day the request was opened; cancelled requests are not counted, and the amounts of rejected requests are not added to the totals. Foreign currency items are not converted to TRY; they are shown separately in the Foreign currency column.
Filters: Period; in Management, Department and Person. Export: Download CSV on every table.
The Visitor tab in Reports
Who: Everyone (the visitors who came to see them) · Reception (visitor owners), people with a Visitor role, Admin · Where: Reports → Visitor
What it does: Shows the visitors who were let in at reception: who they came to see, which company they came from and how they came.
In My reports:
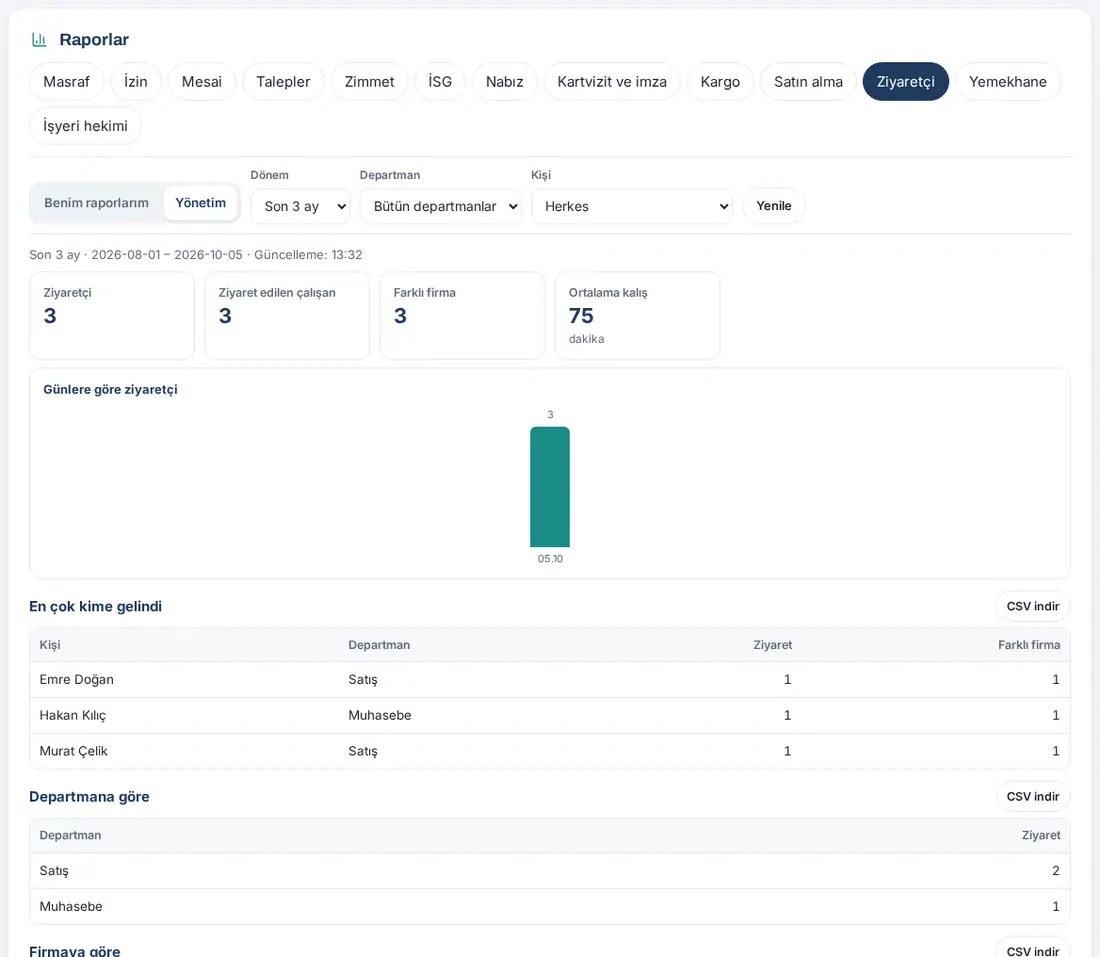
- Boxes: Visitors for me, Different companies, Average stay.
- Tables: Who visited me (Date, Visitor, Company, Check-in, Check-out, Stay, Meeting place), Most frequent companies.
In Management:
- Boxes: Visitor, Employee being visited, Different companies, Average stay.
- The Visitors by day chart.
- Tables: Most visited employees, By department, By company, By day of the week, How they came (meeting booking, notified in advance, self check-in with QR code, reception), Visit list.
- Note: only visits where the visitor was let in are counted; the period is based on the day of entry. Cancelled pre-registrations and pre-registrations where the visitor never came are not counted.
Filters: Period; in Management, Department and Person (by the employee being visited). Export: Download CSV on every table.
Tip: For visitor registration and reception, see 26. Meeting rooms and visitors.
The Canteen tab in Reports
Who: Everyone (their own canteen entries) · Services manager, people with a Meals and canteen role (Viewer and above), Admin · Where: Reports → Canteen
What it does: Shows the entries to the canteen, the daily average and the guests brought in.
In My reports:
- Boxes: In the canteen (days), My guests.
- Table: My guests (Date, Guest, Company).
In Management:
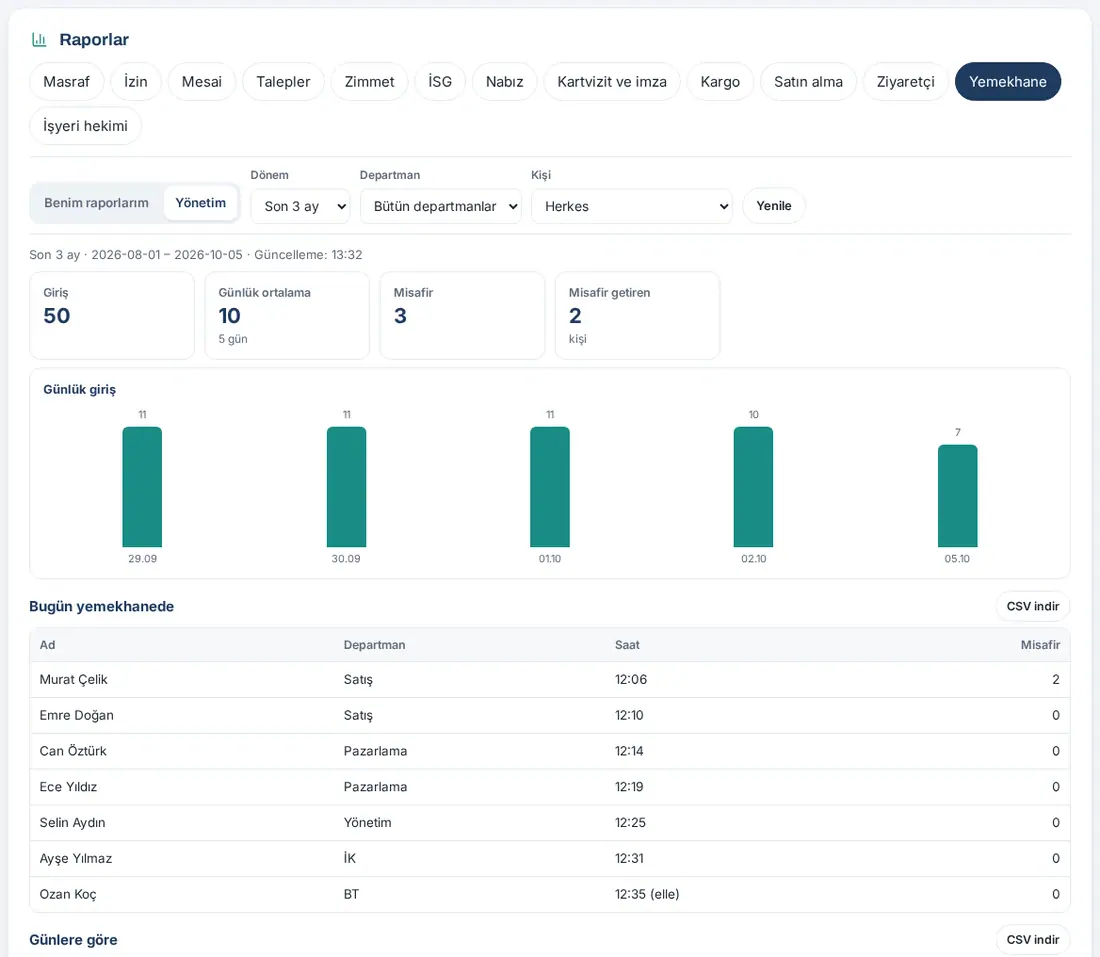
- Boxes: Entries, Daily average, Guest, Brought guests.
- The Daily entries chart.
- Tables: In the canteen today (Name, Department, Time, Guest; for an entry that the staff member added by hand, "(elle)" ("manual") appears next to the time), By day, By person, Guests (Date, Host, Guest, Company).
Filters: Period; in Management, Department and Person. Export: Download CSV on every table.
Tip: For canteen entry, see 25. Shuttle and canteen.
The Occupational physician tab in Reports
Who: Everyone (their own appointments) · OHS owners and Admin (Management) · Where: Reports → Occupational physician
What it does: Shows the number of appointments and consultations with the occupational physician. The content of the consultation is not stored anywhere.
In My reports:
- Boxes: Appointment, Consultation.
- Table: My appointments (Date, Physician, Status).
- Note: "Consultation content is stored nowhere; only the appointment time and status are kept."
In Management:
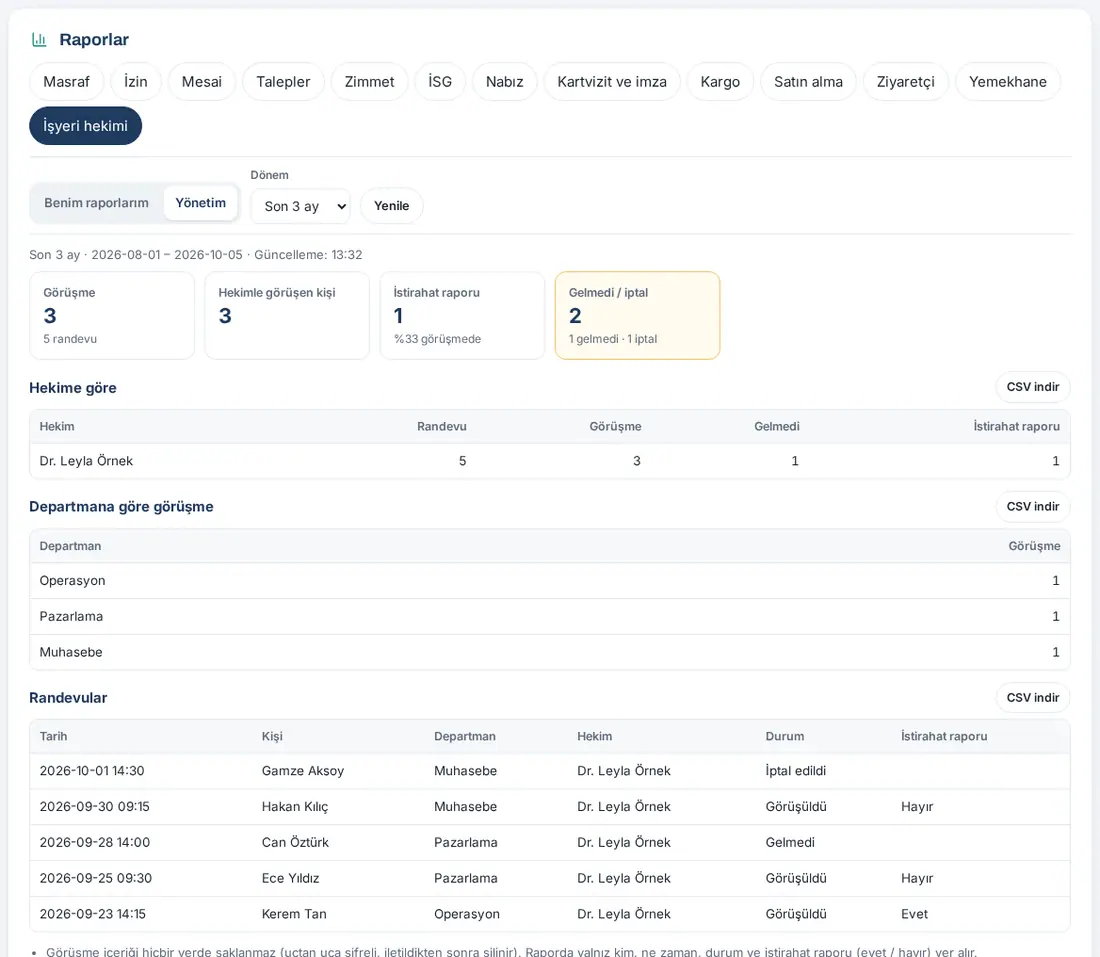
- Boxes: Consultation (with the number of appointments), People who saw the physician, Sick note (percentage of consultations), No-show / cancelled.
- Tables: By physician, Consultations by department, Appointments (Date, Person, Department, Physician, Status, Sick note).
- Note: the report contains only who, when, the status and the sick note (yes / no).
Filters: Period only (there are no department and person filters). Export: Download CSV on every table.
Important: The appointment list contains people's names. Share the CSV only with authorized people. To book an appointment, see 27. Emergencies, occupational safety and the occupational physician.
The Communications tab in Reports
Who: Everyone (their own announcements and Wiki articles) · Admin, Auditor, people allowed to announce to the whole company, Wiki general editors and people with a Wiki role in the permission table (Management) · Where: Reports → Communications
What it does: Shows how many people announcements reached and how many read them, how much Wiki articles are read and whether they were helpful, which words were searched in the Wiki and the questions asked to the Wiki. This tab is open in every company.
In My reports:
- The same boxes and tables for the announcements and Wiki articles you wrote; only numbers are shown, not who saw or read them.
In Management:
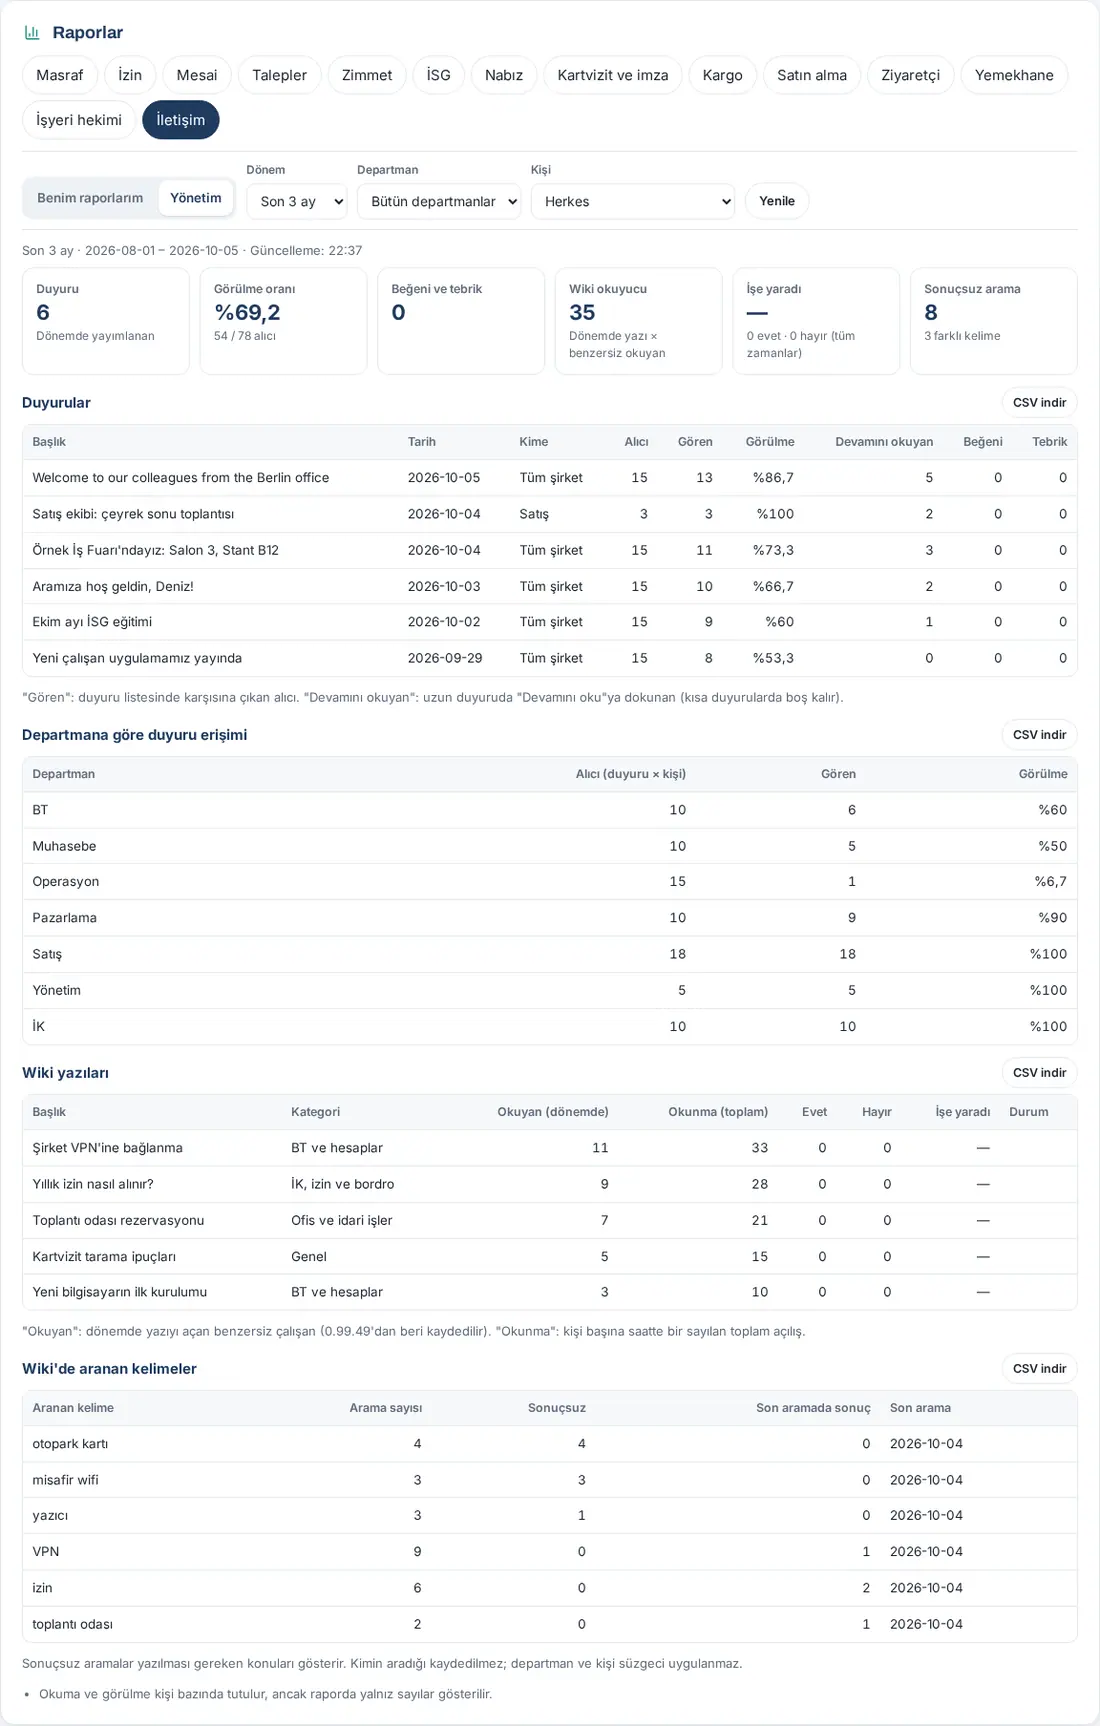
- Boxes: Announcement (published in the period), Seen rate (seen / recipients), Likes and congratulations, Wiki readers (articles × unique readers in the period), Helpful (yes / no rate), Searches with no results.
- Announcements table: Title, Date, To, Recipient, Seen by, Seen, Read in full, Likes, Congratulations, LinkedIn. "Seen by" is a recipient the announcement appeared to in the announcement list; "Read in full" is someone who tapped Read more on a long announcement; "LinkedIn" (0.99.51) is a recipient who tapped Share on LinkedIn on an announcement with LinkedIn sharing turned on (it does not show whether the post was published on LinkedIn; see 06. Board and intranet). If announcements in the period have sharing turned on, the Share on LinkedIn box shows how many announcements have it turned on and the total clicks.
- Announcement reach by department: recipients, seen by and seen rate in each department.
- Wiki articles: Title, Category, Readers (period), Opens (total), Yes, No, Helpful, Status (Needs review if the review date has passed). Reading is recorded since 0.99.49; one person's openings within an hour count once.
- Words searched in the wiki: Search term, Searches, No results, Results in last search, Last searched. Searches with no results come first; they show topics that need an article. Who searched is not recorded; the last 180 days and at most 300 words are kept.
- Asked the Wiki box (0.99.50; when Ask the Wiki is on): questions asked in the period, how many were answered and how many were not in the sources. If the Admin turned on keeping unanswered questions, the Questions with no answer in the Wiki table (Question, Date); who asked is not recorded, kept for 90 days.
Filters: Period; in Management, Department and Person (recipients in announcements and readers in the Wiki are limited to the selected department or person; not applied to searched words). Export: Download CSV on every table.
Important: Reading and seeing are stored per person, but the report shows only numbers. Who read the policies is shown separately in Admin → General → Company policies.
Office report (daily breakdown by office)
Who: Admin, Work time owners and viewers (all employees), managers (only their team) · Where: Board → Today → Offices today → Report
What it does: Shows how many people came to each office today (or on the day you select), who did not come, who is on leave, remote or in the field, and the guests; in the Month view, it gives the office occupancy and the numbers day by day.
The office report is not a separate tab on the Reports page; it opens from the Offices today box on the Board. For the steps, filters and CSV export, see 06. Board and intranet.
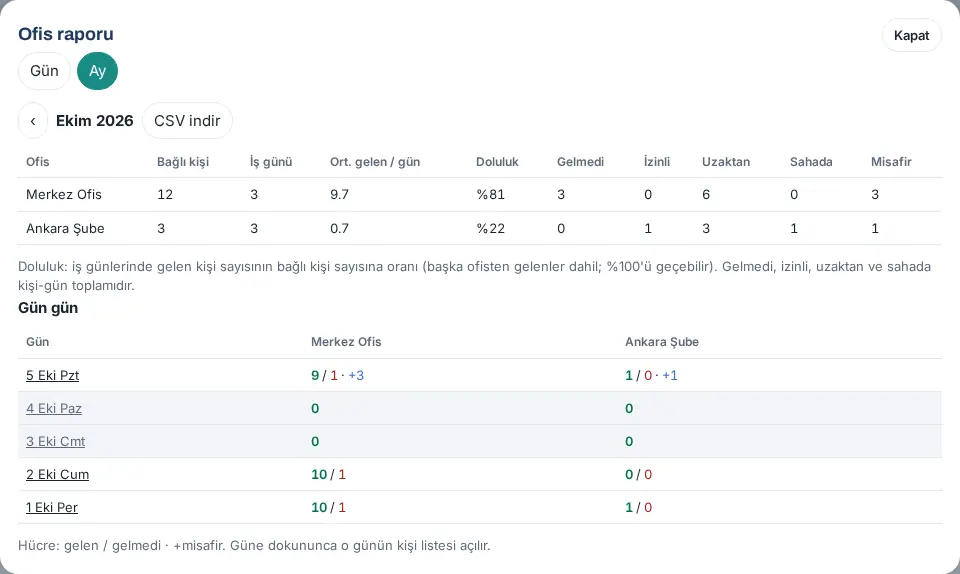
Tip: For net working time, overtime and late arrivals per person, use the Work time tab in Reports; the office report answers only the question "who is where".